The Horn Telescope: An Overview
A horn telescope is simply an antenna designed to pick up radio waves. The horn used in DSPIRA is specifically designed to pick up radio waves emitted by neutral hydrogen atoms in the Milky Way Galaxy, which have a frequency of approximately 1420 MHz. Because it is an antenna, a horn telescope will pick up all radio waves that are incident on it, regardless of their origin. As a result, the signal that is displayed on the spectrometer output includes signals from outer space as well as those from the local environment here on earth. Some of these signals are inherent in the data processing system.
Because we are primarily interested in signals that are coming from astronomical objects, such as the galaxy, we need to subtract out any any other signals that the telescope might be picking up. The spectrum_w_cal.grc Gnuradio program enables the user to do just that so that we can view spectra of signals that are only from the astronomical object of interest.
What Can a Horn Telescope Measure?
The graph below shows a typical spectrum of radio waves from neutral hydrogen detected using the DSPIRA spectrometer program with a horn.
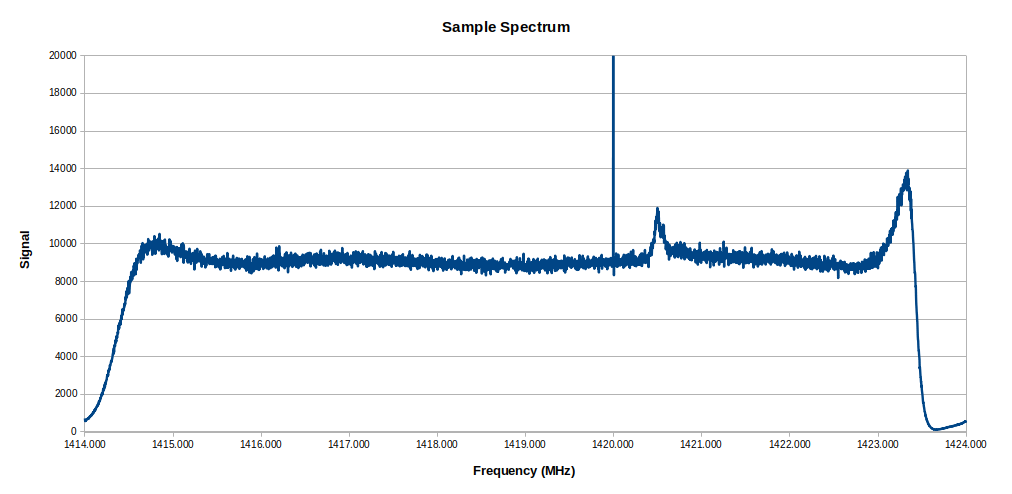
This graph displays the amplitude of radio wave signals collected as the spectrometer scans across frequencies ranging from 1414 MHz to 1424 MHz. The neutral hydrogen signal appears at approximately 1420.4 MHz.
So what are the features appearing in this graph?
The System Background Signal
As mentioned above, part of the signal displayed in the graph is from sources that are not from the galaxy. This can be from noise sources in the local environment as well as signals from the horn detector system itself. The part of the signal that comes from the horn system itself, which includes the electronics and data signal processing, is highlighted in red in the graph below, which is typical for the Airspy software defined radio device used with the DSPIRA telescope.
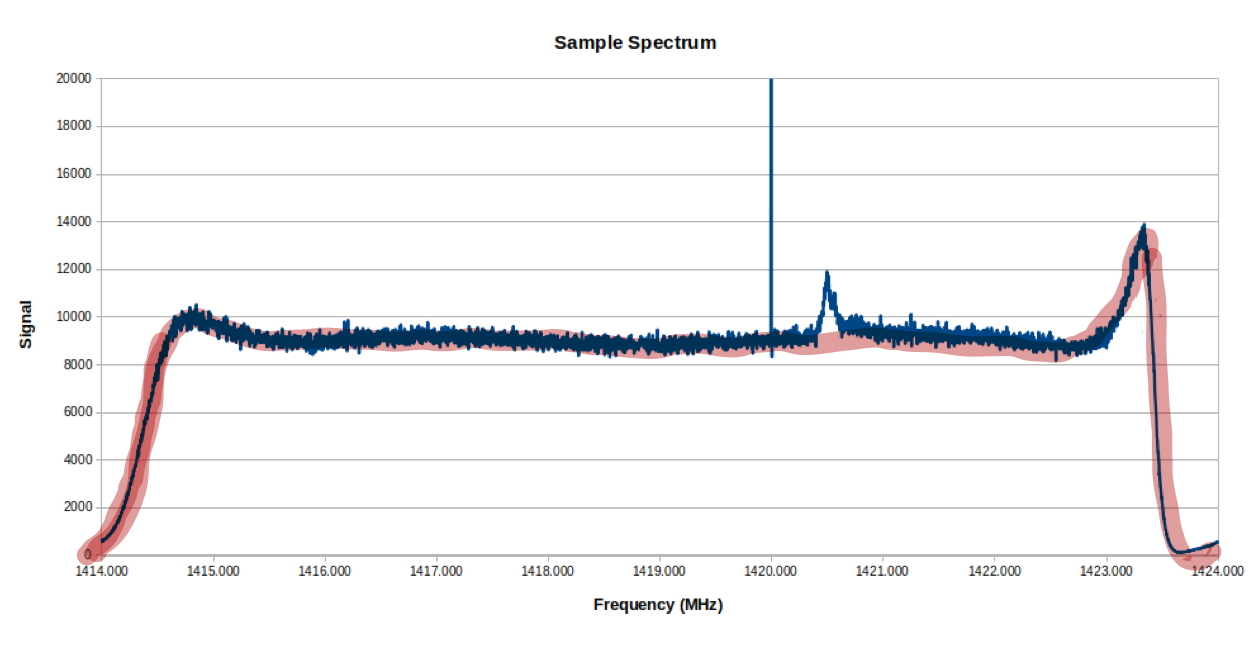
If the telescope is pointed in many different directions, such as different parts of the sky, at the ground, at a building or a tree, the viewer will notice that the characteristic feature highlighted in the spectrum above does not change in shape. For stronger signals, the height of the graph will increase, but this general background shape is always there. This is a result of the data signal processing electronics of the telescope system.
Another feature that typically appears with the Airspy SDR we use is the single line spike that appears at 1420.0 MHz. This comes from the Airspy electronics and is not of interest to us.
The spectrometer_w_cal.grc spectrometer program is designed with the capability of reducing noise spikes and subtracting out the characteristic background signal. This allows the user to display the spectrum of signals that come from only the galaxy.
The Signal from Neutral Hydrogen
For spectral line viewing, the peak that we are interested in is the small peak that may appear at a frequency of approximately 1420.4 MHz. This is the peak identified in the spectrum below.
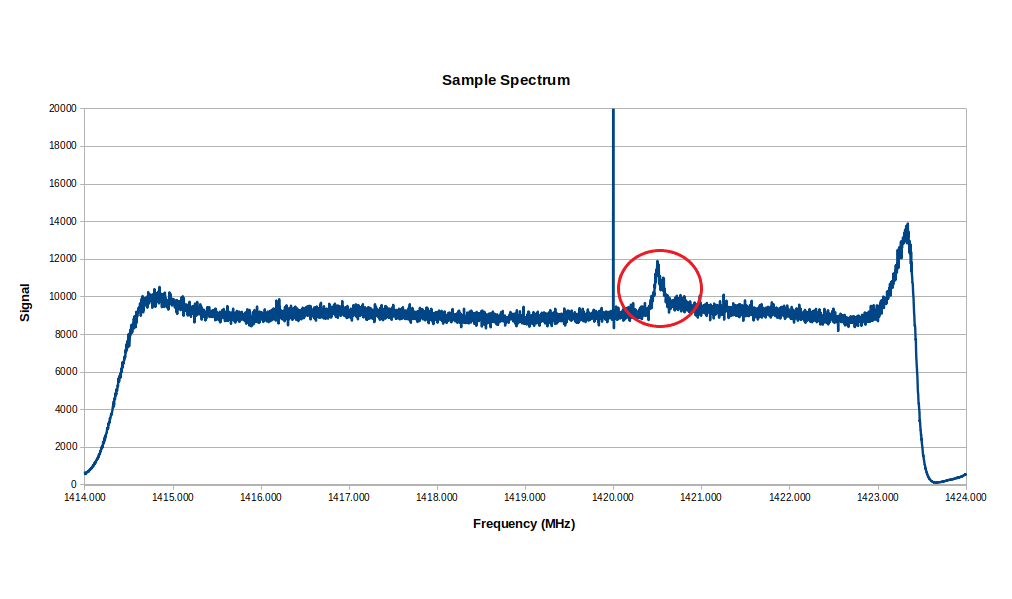
This 1420.4 MHz signal is from radio waves detected from neutral hydrogen atoms in our galaxy. These radio waves are emitted from these hydrogen atoms as a result of a transition that takes place with the electrons in the atoms. The signal emitted from each atom is extremely weak. Fortunately there is a very large amount of neutral hydrogen in our galaxy; so we are able to detect this hydrogen with our radio telescope here on earth. We cannot see these hydrogen atoms directly with the naked eye. This is where the horn radio telescope becomes useful!