
The program used to run the telescope is a GNU Radio program called spectrometer_w_cal.grc. Get it from the DSPIRA software guide. The spectrometer_w_cal.grc program has several features to make data collection with the horn telescope user-friendly. Each feature on the display is described below.
Set up the horn. Cable the LNA to the Airspy, then connect the Airspy to the computer’s USB port. Then open the spectrometer_w_cal.grc program in GNU Radio. This video shows how to set up a horn and start the program.
You can also watch this video, which describes these user interface features in detail.
1. Features of the Spectrum Tab
-
Graphical Display Boxes:
-
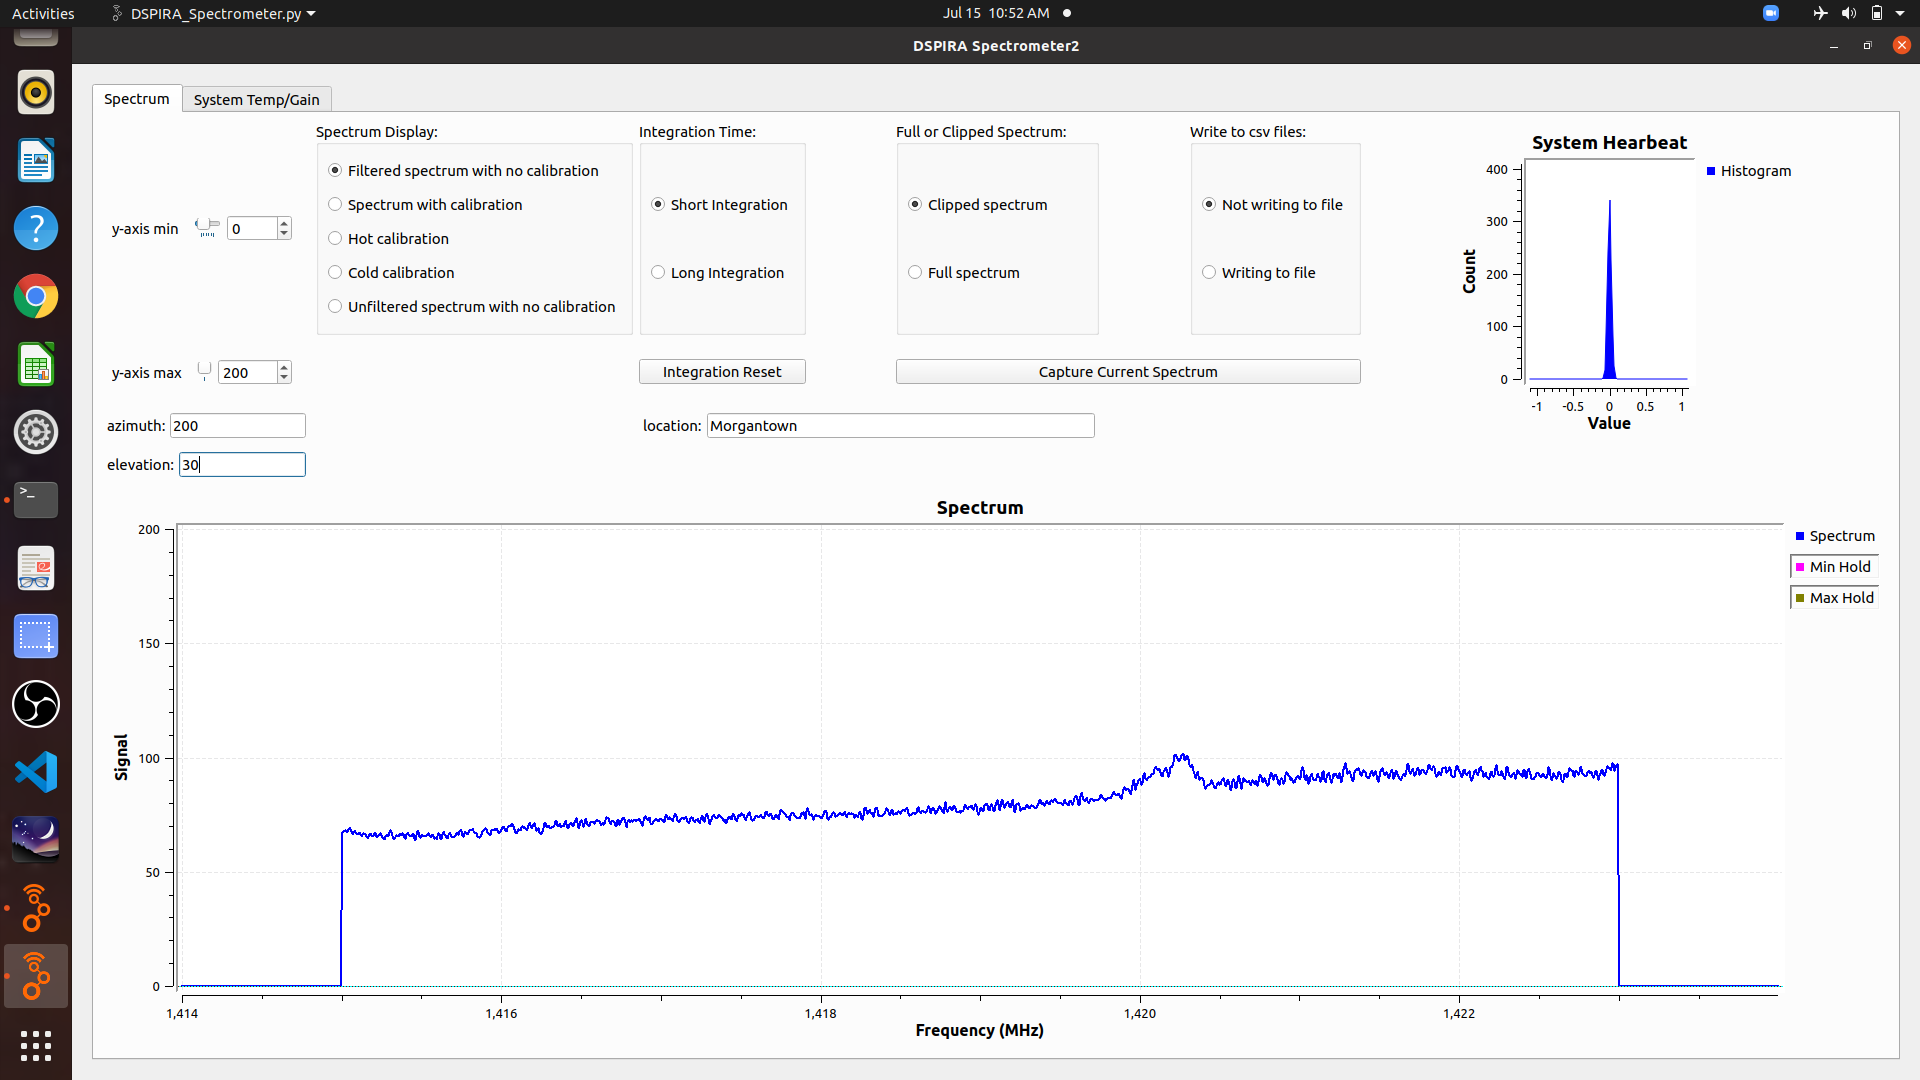
Spectrum graph – shows the signal vs. frequency spectrum, which is the primary focus of our investigations with a radio telescope.
-
System Heartbeat – This is actually a histogram of signals being detected. During normal, this display should continuously jump up and down during a run. As long as its “beating,” things are good. If this graph looks frozen, then the program has probably stopped running, and you will need to restart the program.
-
-
Spectrum Display options:
-
filtered spectrum with no calibration - the raw spectrum collected is displayed with the noise spikes filtered out.
-
spectrum with calibration - the hot and cold calibrations are factored in to display the true signal received from the galaxy.
-
hot calibration - Select when pointing the telescope at the “hot” source (the ground) during the calibration procedure.
-
cold calibration - Select when pointing the telescope at the “hot” source (the ground) during the calibration procedure.
-
unfiltered spectrum with no calibration - the raw spectrum collected is displayed with no changes made to it.
-
-
Integration Time options:
-
The detected radio signals are extremely weak. The software therefore adds signals together, or integrates them, over time. This is the integration time. This averages out the noise in the signal, making the galaxy signal more prominent. The user has the option of setting two different integration times when using this spectrometer.
-
The user can change these settings in the integration variable blocks before starting the program.
- Short Integration
-
This is useful for quick sampling of what the telescope is looking at.
-
The default setting for the shorter integration time is 0.4 s.
-
- Long Integration
-
This is useful for when smoother data is desired. Usually the user will use the longer setting for targeted pointings where “good” data is needed.
-
The default setting for the longer integration time is 10 s.
-
-
-
Integration Reset – This resets the data averaging when the long integration time is selected. Use this when you change the telescope’s pointing during a long integration. It ensures the displayed average represents the new pointing.
-
Full or Clipped Spectrum
-
Clipped spectrum removes both ends of the spectrum: 1414 to 1415 MHz and 1423 to 1424 MHz. This removes distracting background features. See The System Background Signal in What Can a Horn Telescope Measure?.
-
Full spectrum – This is self explanatory.
-
-
Capture Current Spectrum button
- Save the main graph’s live spectrum in a .csv text file for later use.
-
Write to .csv File
-
This option saves the spectrum to a new file after each integration period. It supports unattended data collection.
-
See the video Saving Data Using the spectrometer_w_cal.grc Program.
-
2. Features of the System Temp/Gain Tab
-
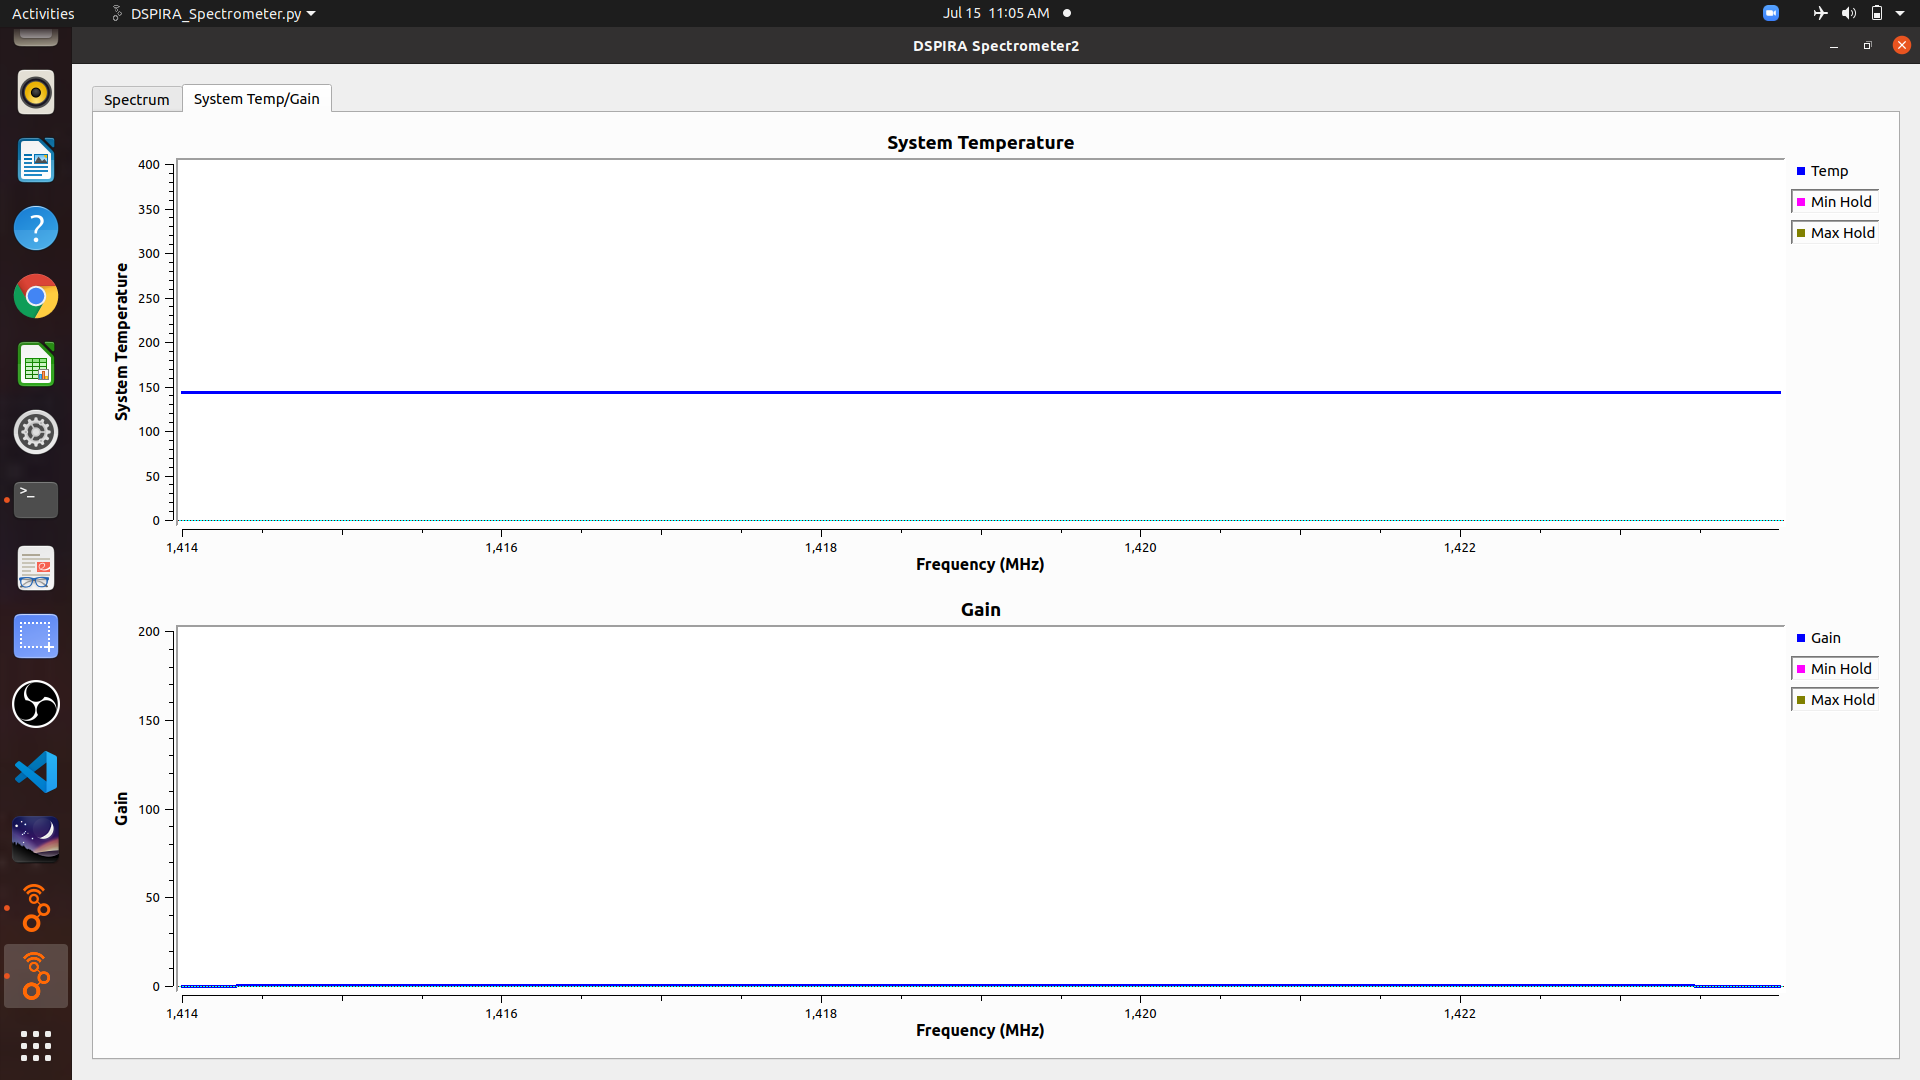
These graphs are not needed during most telescope runs. They are mainly for those who are interested in the quantitative performance of the telescope.
-
System Temperature Spectrum shows the signal contributed by the telescope system itself.
-
Gain – This is the factor that is used by the spectrometer to scale the detected signal into known astronomical units.